A Digital Upstream product
Upstream oil & gas asset performance
20+ specialist agents · one integrated upstream system
A multi-agent AI system for integrated upstream production
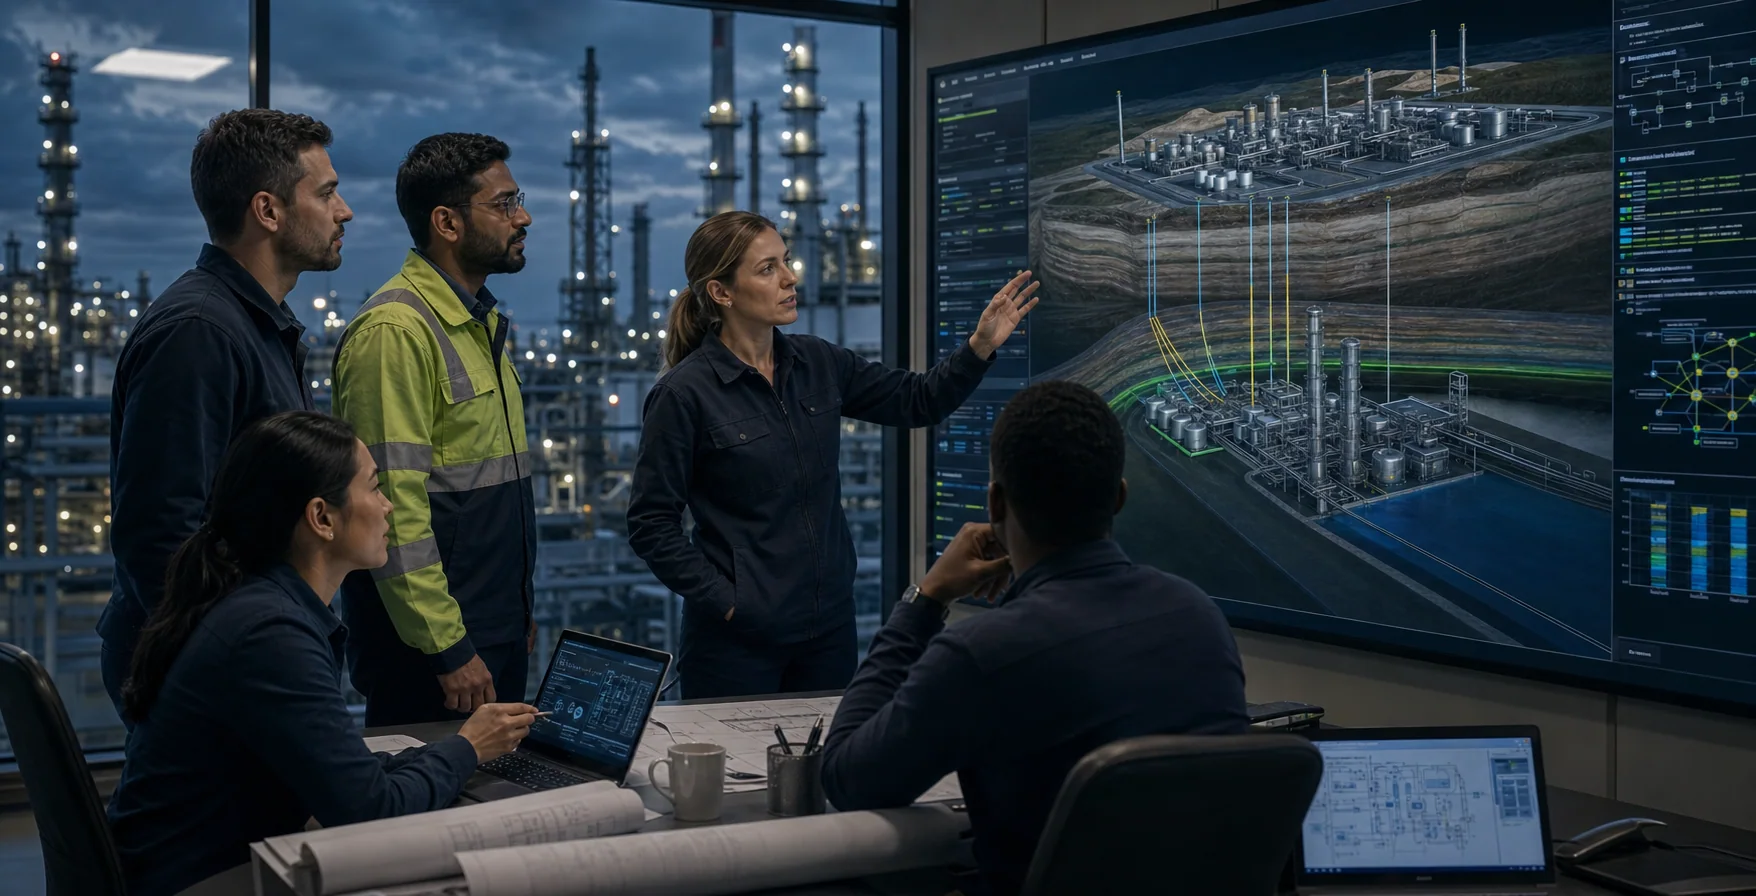
Digital Upstream combines 20+ specialist AI agents with a Physics-Based Digital Twin to improve production across reservoirs, wells, gathering systems and surface facilities.
A calibrated asset model connects subsurface and surface constraints before ranking actions.
- 20+ agentsEngineering, operations and economics
- ContinuousConfigured to asset cadence
- Down to 30 secondsAsset-dependent screening target
Target architectureConfigured and validated for each asset
02 / How the system works
From operating data to a ranked recommendation
Data, engineering models and specialist agents share one decision workflow.
Three system viewsSelect Architecture, Digital Twin or Specialist Agents.
- 01Operational dataTelemetry, tests and equipment status.
- 02Physics-Based Digital TwinCalibrated reservoir-to-facilities scenarios.
- 03Specialist agentsDomain roles diagnose and compare options.
- 04Engineering reviewRanked by constraints, value and uncertainty.

Physics-Based Digital Twin
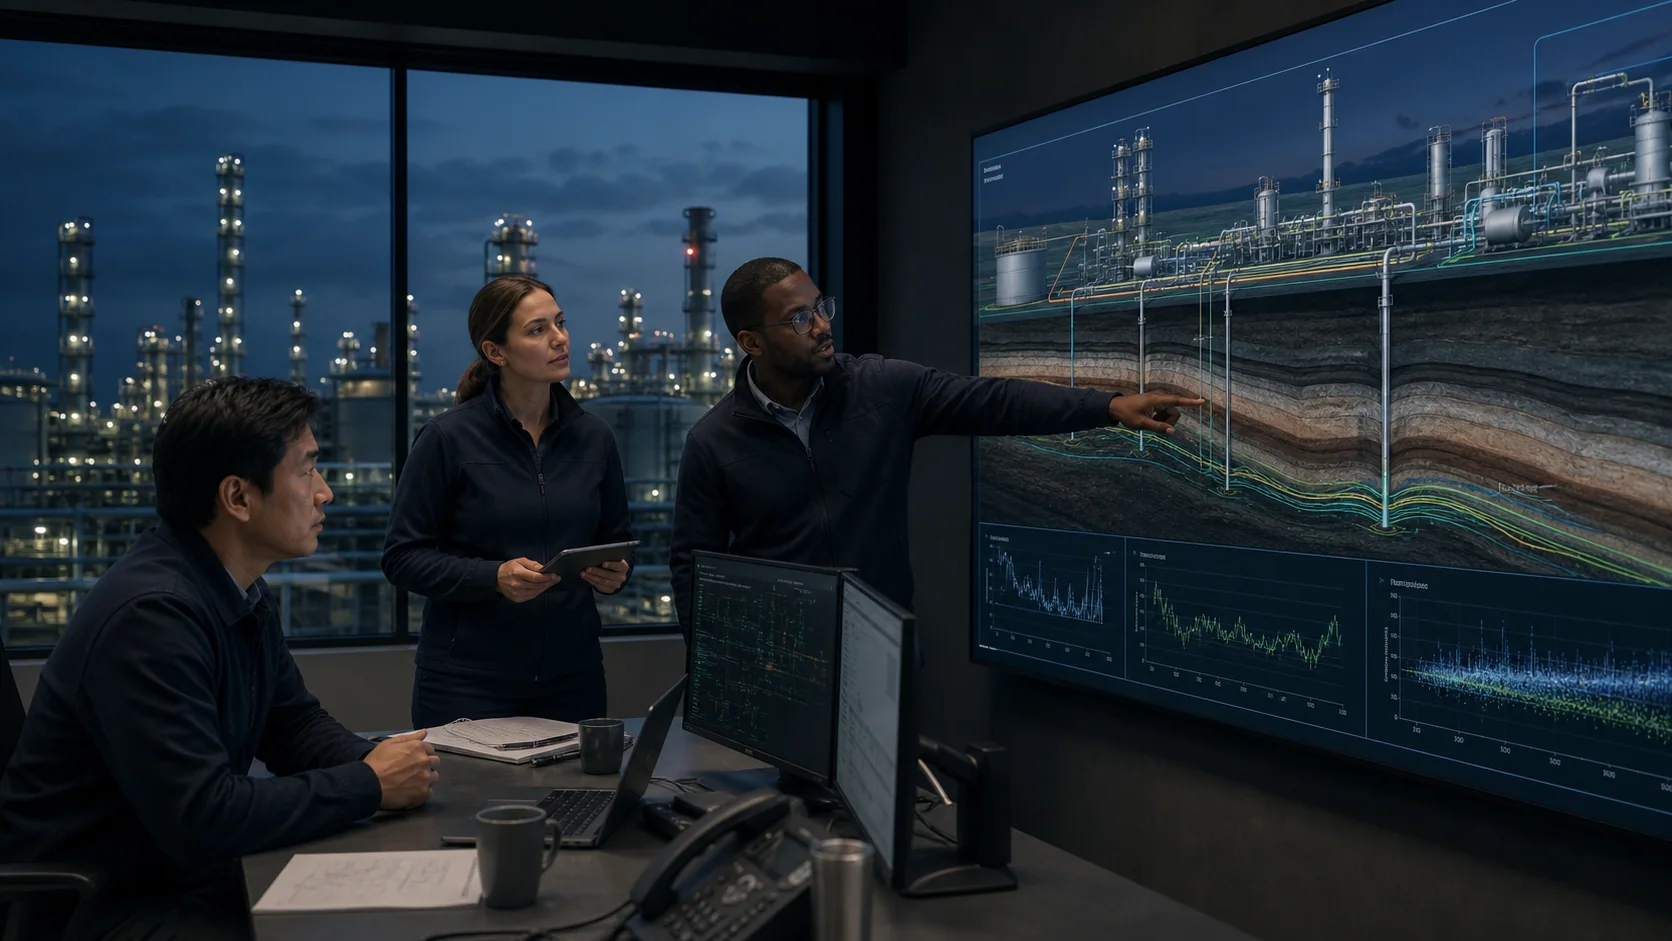
One calibrated asset model
Links reservoir behaviour, PVT, wells, networks, compression and treatment.
- 01
Calibrated state
Reconciled to measurements.
- 02
Coupled physics
Subsurface and facilities respond together.
- 03
Controlled scenarios
Tested within model limits.
- 04
Traceable runs
Inputs, assumptions and limits remain visible.
Integrated asset model
The production chain stays connected
Well changes are checked against downstream capacity, energy, gas quality and condensate recovery.
Scroll through the connected production chain
20+ specialist-agent roles
Specialists organised by discipline
Defined roles cover data, fluids, reservoir, production, facilities and economics.
PVT Specialist
Reservoir Engineer
Production & Flow Assurance
Economist
Operations Dispatcher
Orchestration
Coordinator Agent
Routes specialist work into one ranked comparison.
Engineering decision
Responsible engineer
The system ranks the options. The responsible engineer makes the decision.
Target architecturerepresentative roles shown
03 / Business effects
Four paths to asset value
Measured against each asset baseline.
Production assurance
Detect connected production losses early and identify feasible recovery actions.
Validate deviations and test recovery options in the asset model.
How value is measured: Decision time and avoidable deferment identified.
Condensate recovery
Protect liquids recovery without shifting constraints elsewhere in the production chain.
Compare PVT, well, network and process behaviour together.
How value is measured: Condensate yield and realised intervention value.
Operating efficiency
Coordinate engineering work through shared evidence and fewer manual hand-offs.
Assemble specialist analyses around one calibrated asset state.
How value is measured: Engineering cycle time and review effort.
Capital discipline
Rank interventions consistently by technical value, risk and economics.
Compare alternatives on one physical and economic basis.
How value is measured: Scenarios screened and forecast-versus-realised value.
Results depend on asset baseline, data quality and available interventions.
Engagement
Start with one upstream asset
Define the baseline, scope, data boundary and value measures. One asset. One measurable workflow.
Request a live demoDeveloped and provided by Digital Upstream